Monday Poster Session
Category: Liver
P2912 - Trends in Mortality Caused by Viral Hepatitis in the United States Population: A Retrospective Cross-Sectional Study Using the CDC WONDER Database
Monday, October 28, 2024
10:30 AM - 4:00 PM ET
Location: Exhibit Hall E

- MA
Mohammed Akram, MD
HCA Aventura Hospital
Aventura, FL
Presenting Author(s)
Award: Presidential Poster Award
Mohammed Akram, MD1, Muhammad Sohaib Asghar, MBBS, MD2, Rumael Jawed, MBBS3, Nisar Ahmed, MBBS4
1HCA Aventura Hospital, Aventura, FL; 2AdventHealth, Sebring, FL; 3Nazareth Hospital, Philadelphia, PA; 4Rapido Clinica Familiar, Chicago, IL
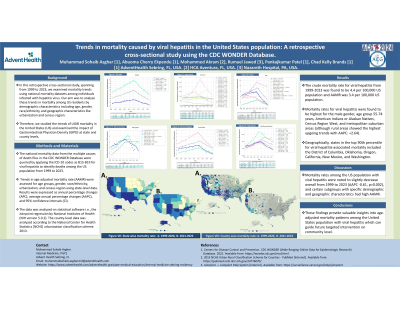
Introduction: In this retrospective cross-sectional study, spanning from 1999 to 2023, we examined mortality trends using national mortality datasets among individuals infected with hepatitis virus. Our aim was to analyze these trends in mortality among US residents by demographic characteristics including age, gender, race/ethnicity, and geographic characteristics like urbanization and census region.
Methods: The national mortality data from the multiple causes of death files in the CDC WONDER Database were queried by applying the ICD-10 codes as B15-B19 for viral hepatitis to identify deaths among the US population from 1999 to 2023. Trends in age-adjusted mortality rate (AAMR) were assessed for age groups, gender, race/ethnicity, urbanization, and census region using state-level data. Results were expressed as annual percentage changes (APC), average annual percentage changes (AAPC), and 95% confidence intervals (CI). The data was analyzed on statistical software i.e., the Joinpoint regression by National Institutes of Health (NIH version 5.0.2). The county-level data was analyzed according to the National Center for Health Statistics [NCHS] urbanization classification scheme 2013.
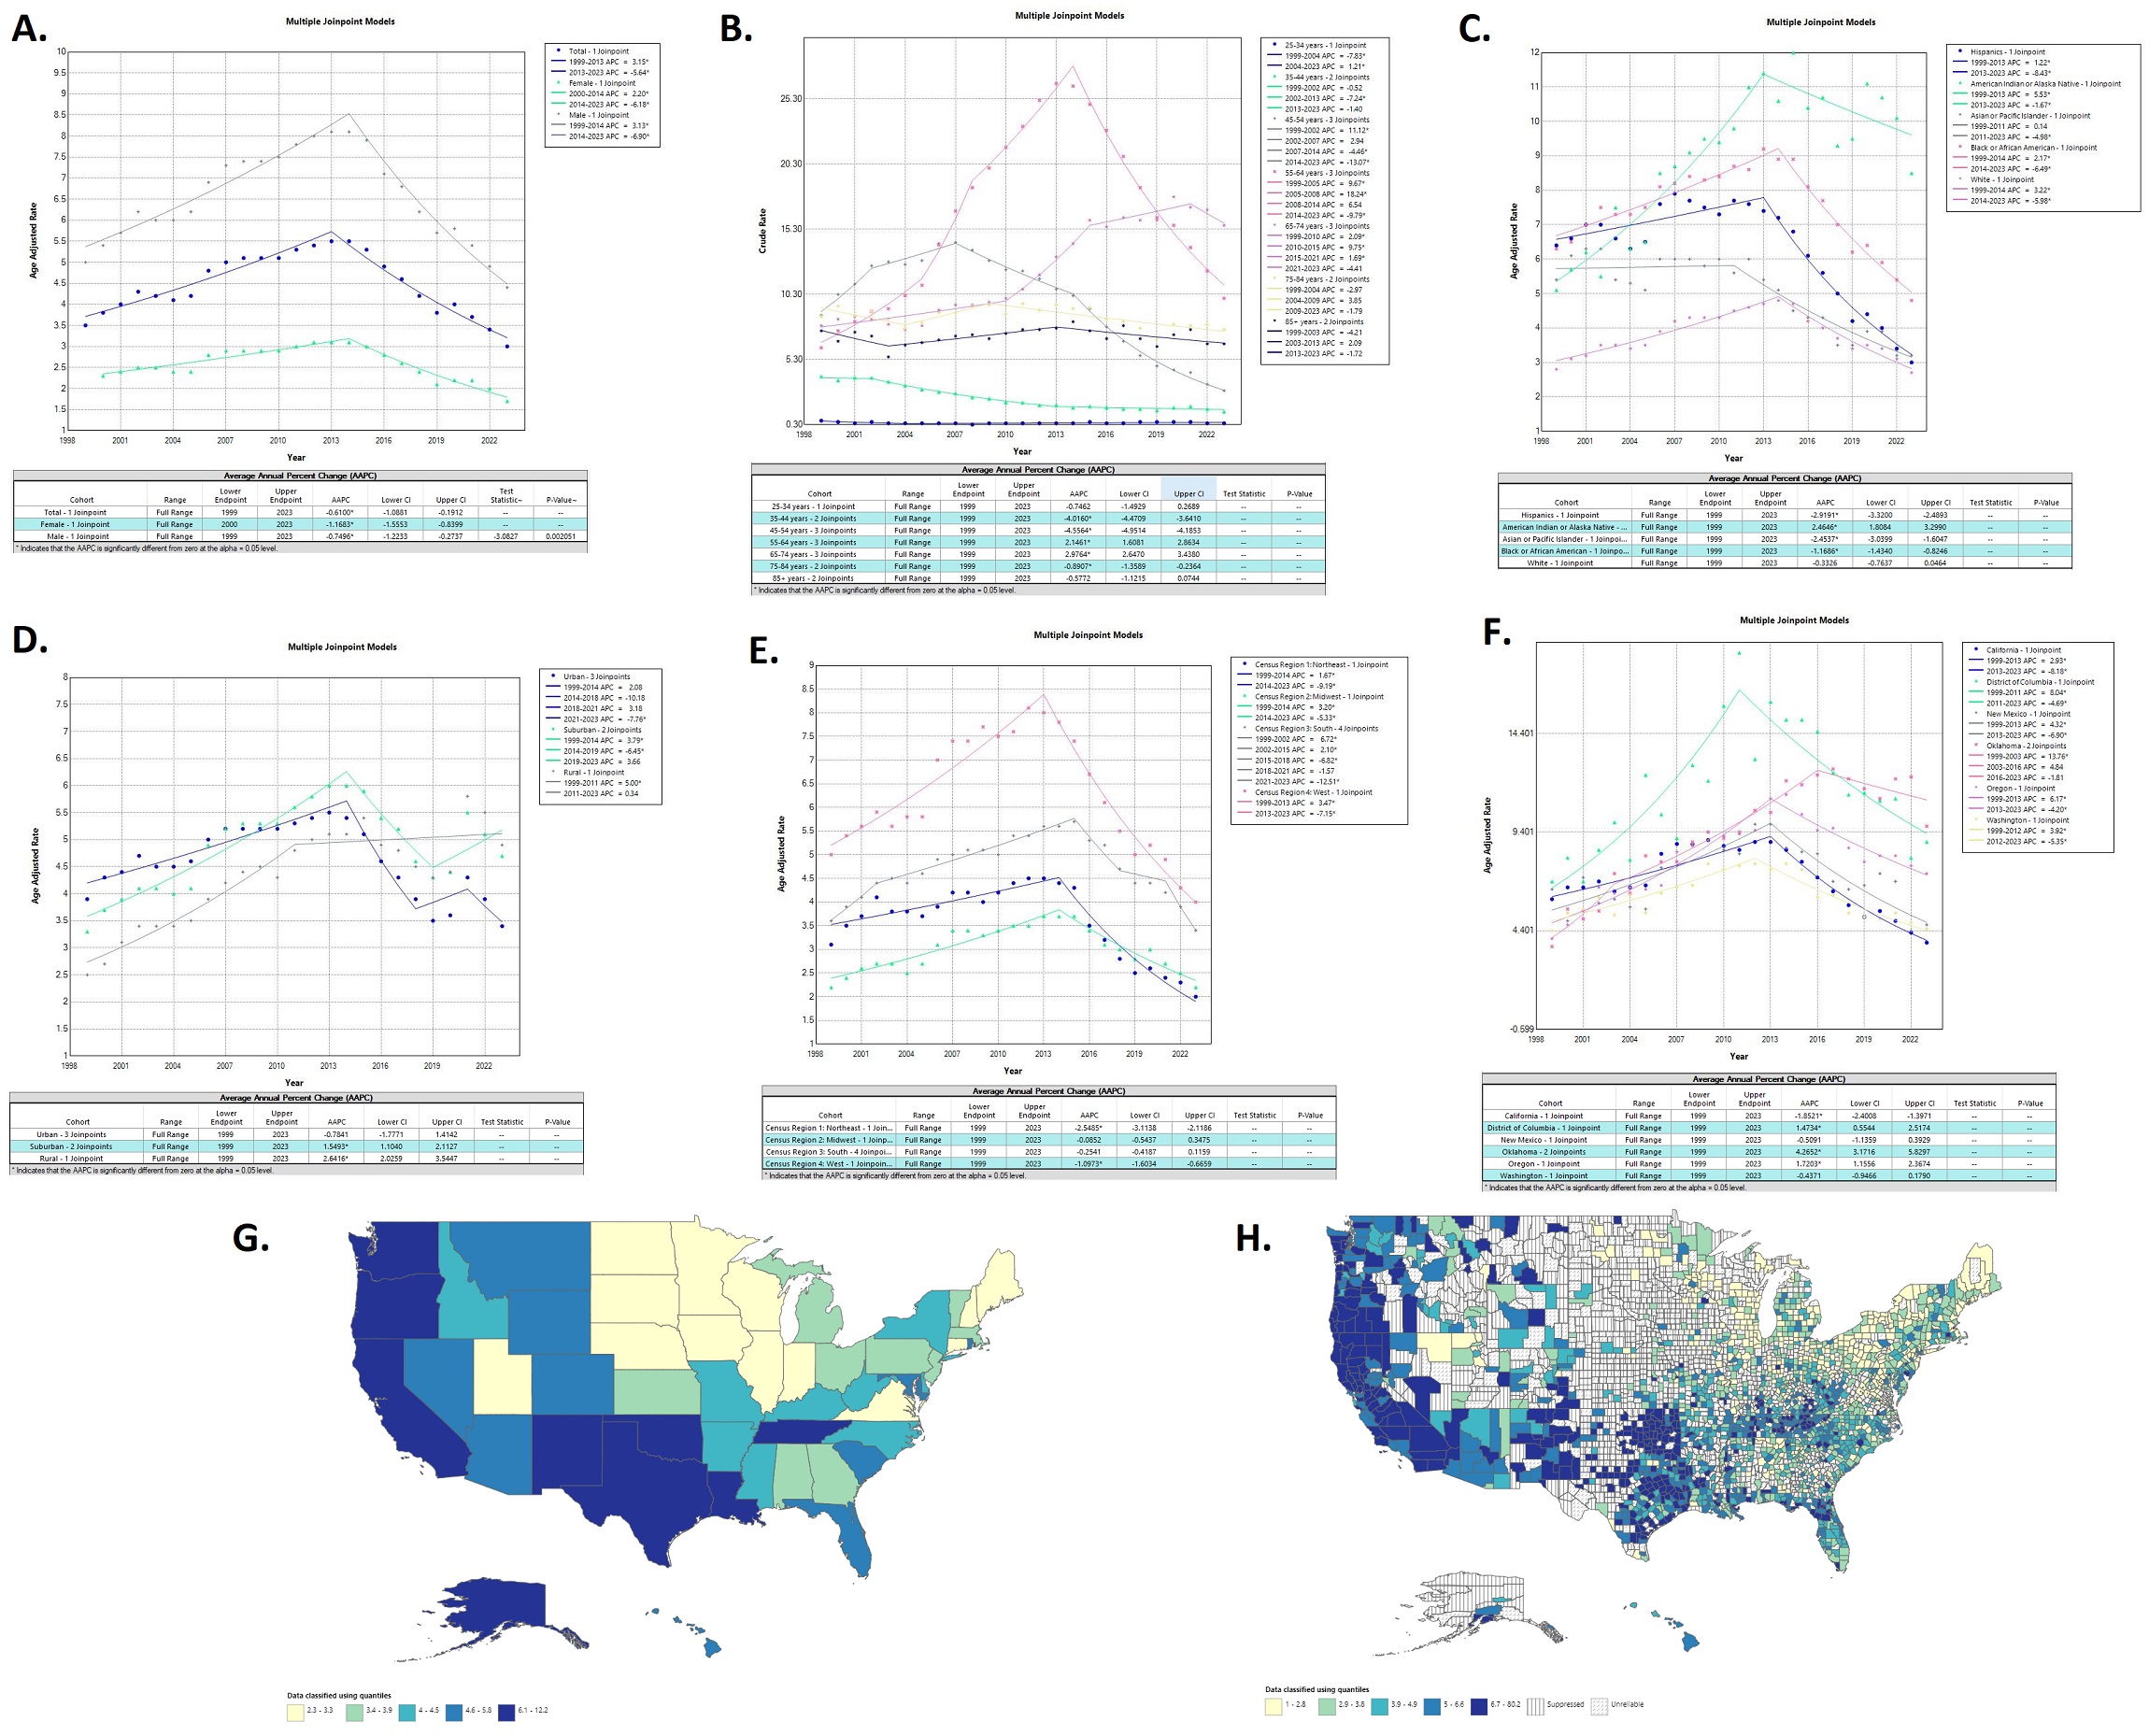
Results: The crude mortality rate for viral hepatitis from 1999-2023 was found to be 4.4 per 100,000 US population and AAMR was 3.4 per 100,000 US population. Mortality rates for viral hepatitis were found to be highest for the male gender, age group 55-74 years, American Indians or Alaskan Natives, Census Region West, and metropolitan suburban areas (although rural areas showed the highest upgoing trends with AAPC: +2.64). Geographically, states in the top 90th percentile for viral hepatitis-associated mortality included the District of Columbia, Oklahoma, Oregon, California, New Mexico, and Washington.
Discussion: These findings provide valuable insights into age-adjusted mortality patterns among the United States population with these diseases. Mortality rates among the US population with viral hepatitis were noted to slightly decrease overall from 1999 to 2023 (AAPC -0.61, p=0.002), and certain subgroups with specific demographic and geographic characteristics had high AAMR.

Disclosures:
Mohammed Akram, MD1, Muhammad Sohaib Asghar, MBBS, MD2, Rumael Jawed, MBBS3, Nisar Ahmed, MBBS4. P2912 - Trends in Mortality Caused by Viral Hepatitis in the United States Population: A Retrospective Cross-Sectional Study Using the CDC WONDER Database, ACG 2024 Annual Scientific Meeting Abstracts. Philadelphia, PA: American College of Gastroenterology.
Mohammed Akram, MD1, Muhammad Sohaib Asghar, MBBS, MD2, Rumael Jawed, MBBS3, Nisar Ahmed, MBBS4
1HCA Aventura Hospital, Aventura, FL; 2AdventHealth, Sebring, FL; 3Nazareth Hospital, Philadelphia, PA; 4Rapido Clinica Familiar, Chicago, IL
Introduction: In this retrospective cross-sectional study, spanning from 1999 to 2023, we examined mortality trends using national mortality datasets among individuals infected with hepatitis virus. Our aim was to analyze these trends in mortality among US residents by demographic characteristics including age, gender, race/ethnicity, and geographic characteristics like urbanization and census region.
Methods: The national mortality data from the multiple causes of death files in the CDC WONDER Database were queried by applying the ICD-10 codes as B15-B19 for viral hepatitis to identify deaths among the US population from 1999 to 2023. Trends in age-adjusted mortality rate (AAMR) were assessed for age groups, gender, race/ethnicity, urbanization, and census region using state-level data. Results were expressed as annual percentage changes (APC), average annual percentage changes (AAPC), and 95% confidence intervals (CI). The data was analyzed on statistical software i.e., the Joinpoint regression by National Institutes of Health (NIH version 5.0.2). The county-level data was analyzed according to the National Center for Health Statistics [NCHS] urbanization classification scheme 2013.
Results: The crude mortality rate for viral hepatitis from 1999-2023 was found to be 4.4 per 100,000 US population and AAMR was 3.4 per 100,000 US population. Mortality rates for viral hepatitis were found to be highest for the male gender, age group 55-74 years, American Indians or Alaskan Natives, Census Region West, and metropolitan suburban areas (although rural areas showed the highest upgoing trends with AAPC: +2.64). Geographically, states in the top 90th percentile for viral hepatitis-associated mortality included the District of Columbia, Oklahoma, Oregon, California, New Mexico, and Washington.
Discussion: These findings provide valuable insights into age-adjusted mortality patterns among the United States population with these diseases. Mortality rates among the US population with viral hepatitis were noted to slightly decrease overall from 1999 to 2023 (AAPC -0.61, p=0.002), and certain subgroups with specific demographic and geographic characteristics had high AAMR.

Figure: Figure 1: Trends in mortality rates for viral hepatitis (from 1999-2023) among gender (A), age groups (B), race (C), metropolitan (D), census region (E), top percentile States (F), and State-wise (G) and County-wise (H) prevalence from 1999-2020.
Disclosures:
Mohammed Akram indicated no relevant financial relationships.
Muhammad Sohaib Asghar indicated no relevant financial relationships.
Rumael Jawed indicated no relevant financial relationships.
Nisar Ahmed indicated no relevant financial relationships.
Mohammed Akram, MD1, Muhammad Sohaib Asghar, MBBS, MD2, Rumael Jawed, MBBS3, Nisar Ahmed, MBBS4. P2912 - Trends in Mortality Caused by Viral Hepatitis in the United States Population: A Retrospective Cross-Sectional Study Using the CDC WONDER Database, ACG 2024 Annual Scientific Meeting Abstracts. Philadelphia, PA: American College of Gastroenterology.

