Sunday Poster Session
Category: Liver
P1201 - Single Cell RNAseq Analysis of Renalase and ATP2B4 expression in Liver Pathology and Tissue Injury
Sunday, October 27, 2024
3:30 PM - 7:00 PM ET
Location: Exhibit Hall E

Has Audio

Daniel Segarra, MD
University of South Florida Morsani College of Medicine
Tampa, Florida
Presenting Author(s)
Daniel Segarra, MD1, Alam Merchant, MD2, Francisco M. Pascual, MD3, Denys Bizyayev, BS4, Saif Zaman, MD5, Shaffer Mok, MD6
1University of South Florida Morsani College of Medicine, Tampa, FL; 2Emory University School of Medicine, Atlanta, GA; 3University of South Florida Health, Tampa, FL; 4New York Institute of Technology College of Osteopathic Medicine, Stamford, CT; 5Yale University School of Medicine, New Haven, CT; 6Moffitt Cancer Center, Tampa, FL
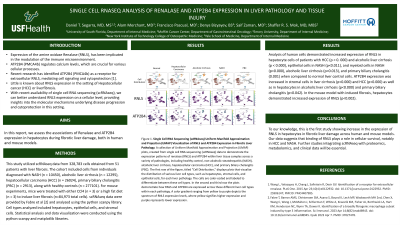
Introduction: Expression of the amine oxidase Renalase (RNLS) has been implicated in the modulation of the immune microenvironment. ATP2B4 (PMCA4b) regulates calcium levels, which are crucial for various cellular processes. Recent research has identified ATP2B4 (PMCA4b) as a receptor for extracellular RNLS, mediating cell signaling and cytoprotection. Little is known about RNLS expression in the setting of Hepatocellular cancer (HCC) or liver fibrosis. With recent availability of single cell RNA sequencing (scRNAseq), we can better understand RNLS expression on a cellular level, providing insights into the molecular mechanisms underlying disease progression and cytoprotection in this setting.
Methods: This study utilized scRNAseq data from 328,783 cells obtained from 51 patients with liver fibrosis. The cohort included cells from individuals diagnosed with NASH (n = 10450), alcoholic liver cirrhosis (n = 12295), hepatocellular carcinoma (HCC) (n = 26024), primary biliary cholangitis (PBC) (n = 2913), along with healthy controls (n = 277101). For mouse experiments, mice were treated with either CCl4 (n = 3) or a high fat diet (n = 3) to induce liver fibrosis (n=84,973 total cells). scRNAseq data were provided by Fabre et al and analyzed using the python scanpy library. Cell types analyzed included hepatocytes, epithelial cells, and stromal cells. Statistical analysis and data visualization were conducted using the python scanpy and matplotlib libraries.
Results: Analysis of human cells demonstrated increased expression of RNLS in hepatocyte cells of patients with HCC (p < 0. 000) and alcoholic liver cirrhosis (p < 0.000), epithelial cells in NASH (p< 0.011), and myeloid cells in NASH (p< 0.000), alcoholic liver cirrhosis (p< 0.013), and primary biliary cholangitis (0.001) when compared to normal liver control cells. ATP2B4 expression was increased in stromal cells in liver cirrhosis (p< 0.000) and HCC (p< 0.000) as well as in hepatocytes in alcoholic liver cirrhosis (p< 0.000) and primary biliary cholangitis (p< 0.042). In the mouse model with induced fibrosis, hepatocytes demonstrated increased expression of RNLS (p< 0.002).
Discussion: To our knowledge, this is the first study showing increase in the expression of RNLS in hepatocytes in fibrotic liver damage across human and mouse models. Our data suggests that binding of RNLS plays a role in cellular survival, notably in HCC and NASH. Future studies integrating scRNAseq with proteomics, metabolomics, and clinical data will be essential.

Disclosures:
Daniel Segarra, MD1, Alam Merchant, MD2, Francisco M. Pascual, MD3, Denys Bizyayev, BS4, Saif Zaman, MD5, Shaffer Mok, MD6. P1201 - Single Cell RNAseq Analysis of Renalase and ATP2B4 expression in Liver Pathology and Tissue Injury, ACG 2024 Annual Scientific Meeting Abstracts. Philadelphia, PA: American College of Gastroenterology.
1University of South Florida Morsani College of Medicine, Tampa, FL; 2Emory University School of Medicine, Atlanta, GA; 3University of South Florida Health, Tampa, FL; 4New York Institute of Technology College of Osteopathic Medicine, Stamford, CT; 5Yale University School of Medicine, New Haven, CT; 6Moffitt Cancer Center, Tampa, FL
Introduction: Expression of the amine oxidase Renalase (RNLS) has been implicated in the modulation of the immune microenvironment. ATP2B4 (PMCA4b) regulates calcium levels, which are crucial for various cellular processes. Recent research has identified ATP2B4 (PMCA4b) as a receptor for extracellular RNLS, mediating cell signaling and cytoprotection. Little is known about RNLS expression in the setting of Hepatocellular cancer (HCC) or liver fibrosis. With recent availability of single cell RNA sequencing (scRNAseq), we can better understand RNLS expression on a cellular level, providing insights into the molecular mechanisms underlying disease progression and cytoprotection in this setting.
Methods: This study utilized scRNAseq data from 328,783 cells obtained from 51 patients with liver fibrosis. The cohort included cells from individuals diagnosed with NASH (n = 10450), alcoholic liver cirrhosis (n = 12295), hepatocellular carcinoma (HCC) (n = 26024), primary biliary cholangitis (PBC) (n = 2913), along with healthy controls (n = 277101). For mouse experiments, mice were treated with either CCl4 (n = 3) or a high fat diet (n = 3) to induce liver fibrosis (n=84,973 total cells). scRNAseq data were provided by Fabre et al and analyzed using the python scanpy library. Cell types analyzed included hepatocytes, epithelial cells, and stromal cells. Statistical analysis and data visualization were conducted using the python scanpy and matplotlib libraries.
Results: Analysis of human cells demonstrated increased expression of RNLS in hepatocyte cells of patients with HCC (p < 0. 000) and alcoholic liver cirrhosis (p < 0.000), epithelial cells in NASH (p< 0.011), and myeloid cells in NASH (p< 0.000), alcoholic liver cirrhosis (p< 0.013), and primary biliary cholangitis (0.001) when compared to normal liver control cells. ATP2B4 expression was increased in stromal cells in liver cirrhosis (p< 0.000) and HCC (p< 0.000) as well as in hepatocytes in alcoholic liver cirrhosis (p< 0.000) and primary biliary cholangitis (p< 0.042). In the mouse model with induced fibrosis, hepatocytes demonstrated increased expression of RNLS (p< 0.002).
Discussion: To our knowledge, this is the first study showing increase in the expression of RNLS in hepatocytes in fibrotic liver damage across human and mouse models. Our data suggests that binding of RNLS plays a role in cellular survival, notably in HCC and NASH. Future studies integrating scRNAseq with proteomics, metabolomics, and clinical data will be essential.

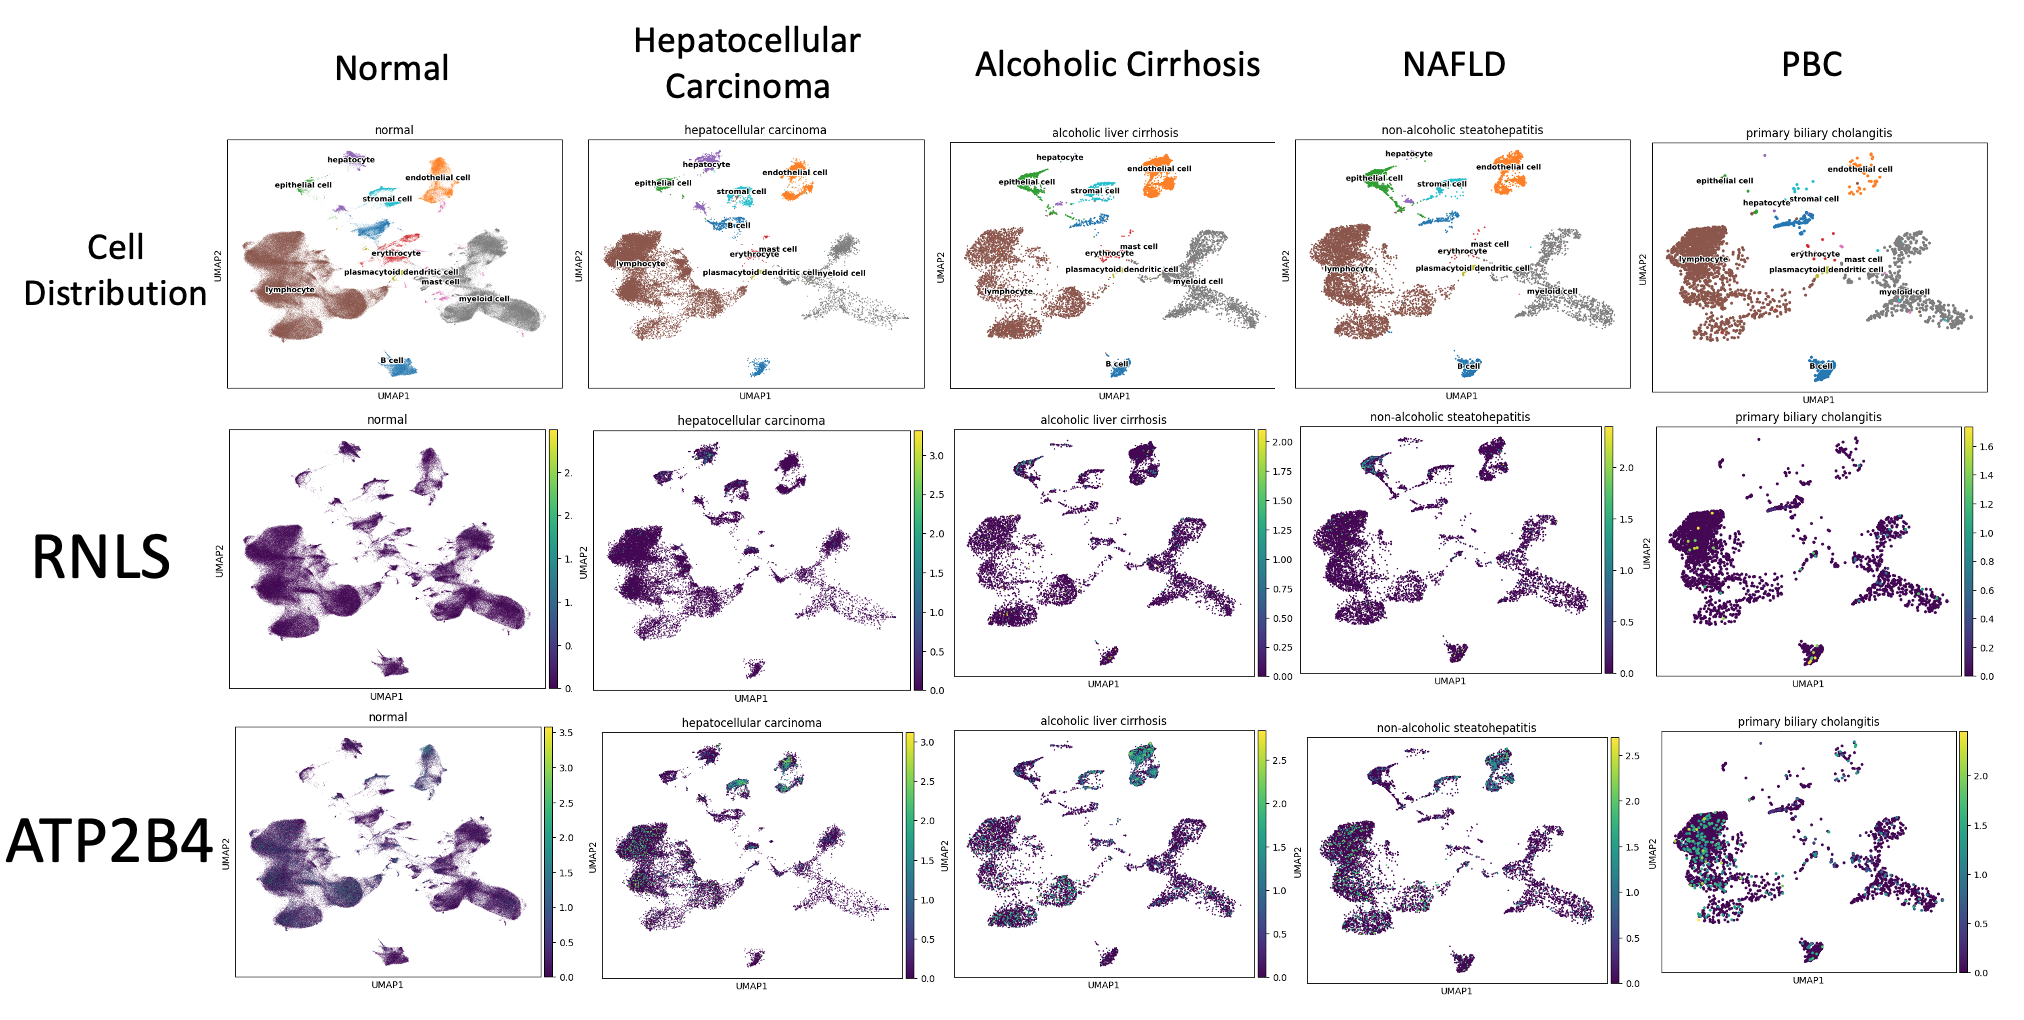
Figure: Single Cell RNA Sequencing (scRNAseq) Uniform Manifold Approximation and Projection (UMAP) Visualization of RNLS and ATP2B4 Expression in Fibrotic Liver Pathology. A collection of Uniform Manifold Approximation and Projection (UMAP) plots, created from single cell RNA sequencing (scRNAseq) data to demonstrate the expression patterns of renalase (RNLS) and within liver tissue samples across a variety of pathologies, including healthy control, non-alcoholic steatohepatitis (NASH), alcoholic liver cirrhosis, hepatocellular carcinoma (HCC), and primary biliary cholangitis (PBC). The first row of the figure, titled "Cell Distribution," displays plots that visualize the distribution of various liver cell types, such as hepatocytes, stromal cells, and epithelial cells, for each liver pathology. The cells are color-coded and labeled to differentiate between these cell types. In the second and third row the plots demonstrate how RNLS and ATP2B4 are expressed across these different liver cell types within each pathology. A color gradient ranging from yellow to purple depicts the spectrum of RNLS expression levels, where yellow signifies higher expression and purple represents lower expression.
Disclosures:
Daniel Segarra indicated no relevant financial relationships.
Alam Merchant indicated no relevant financial relationships.
Francisco Pascual indicated no relevant financial relationships.
Denys Bizyayev indicated no relevant financial relationships.
Saif Zaman indicated no relevant financial relationships.
Shaffer Mok: C2/Pentax – Consultant. Steris – Consultant.
Daniel Segarra, MD1, Alam Merchant, MD2, Francisco M. Pascual, MD3, Denys Bizyayev, BS4, Saif Zaman, MD5, Shaffer Mok, MD6. P1201 - Single Cell RNAseq Analysis of Renalase and ATP2B4 expression in Liver Pathology and Tissue Injury, ACG 2024 Annual Scientific Meeting Abstracts. Philadelphia, PA: American College of Gastroenterology.
